GA4 has been the default analytics platform for over two years now, and most Indian marketers still haven't set it up properly. They're logging in, staring at the default reports, feeling overwhelmed by the new interface, and logging out without extracting any actionable insights.
The problem isn't GA4 itself. It's that GA4's default reports are designed for product teams, not marketers. The reports you actually need — the ones that tell you which channels drive revenue, where visitors drop off, and which campaigns justify their budget — need to be built manually.
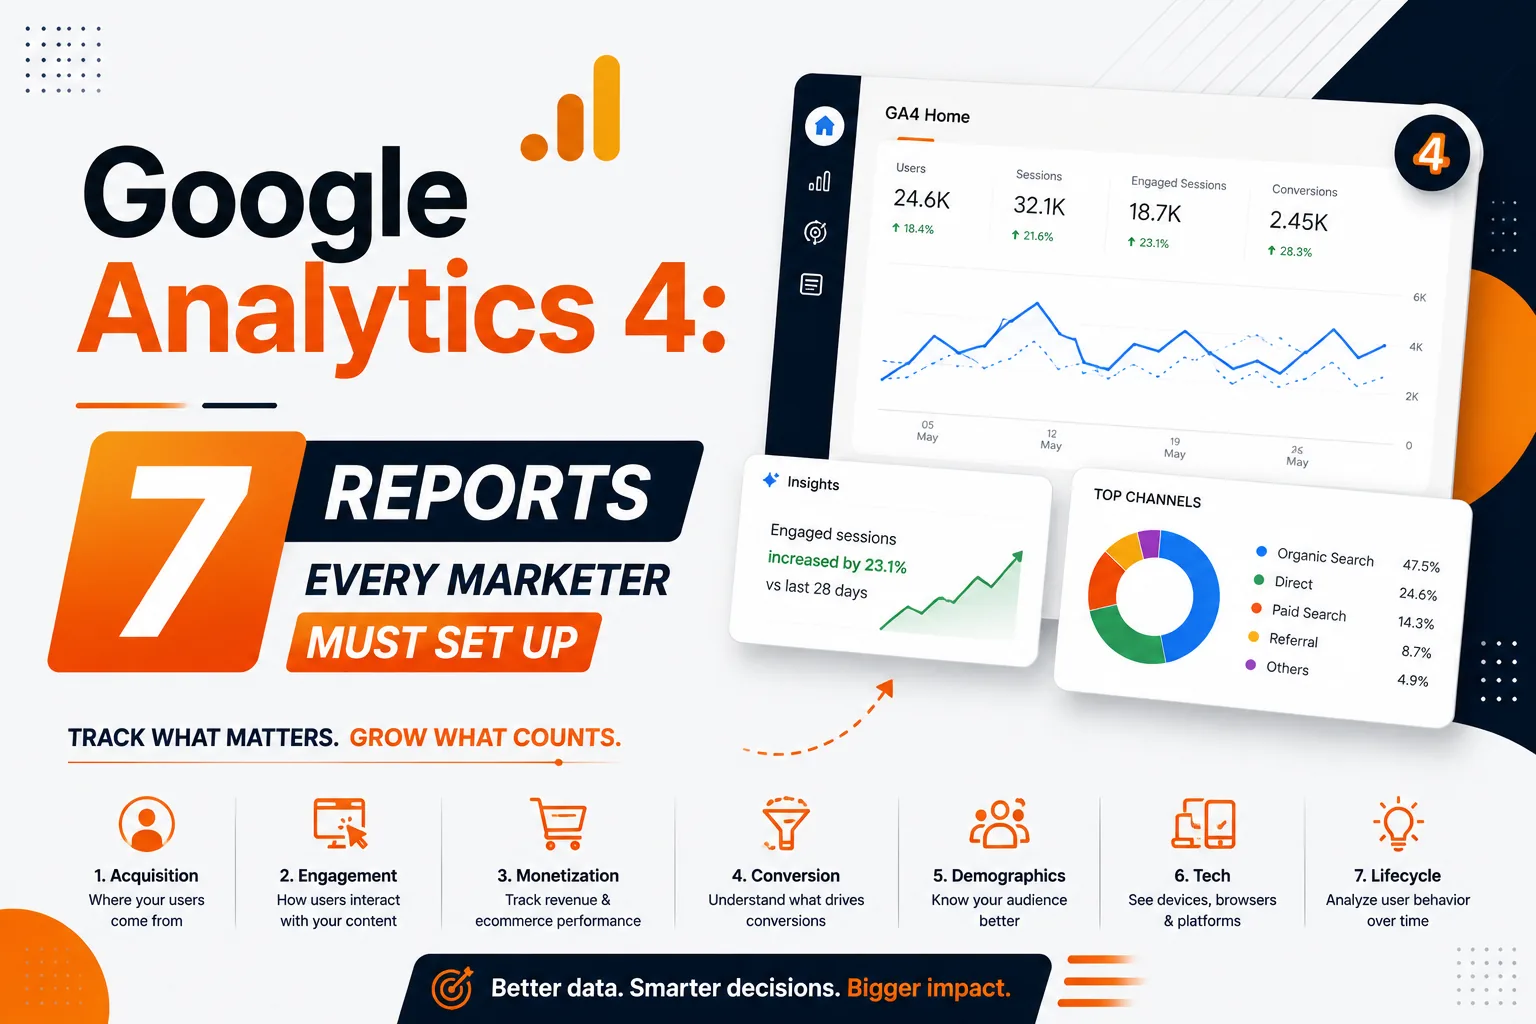
Here are the 7 custom GA4 reports that every marketer should set up immediately, with step-by-step instructions you can follow in under 2 hours. This is the essential Google Analytics 4 setup playbook.
📊 Need help with GA4 setup? DigiVeritaz's data team configures analytics for measurable ROI through its Data Strategy Consulting Services.
1. The Channel Performance Report (Which Channels Drive Revenue?)
This is the single most important report for any marketer. Navigate to Reports > Acquisition > Traffic Acquisition. Customize it to show: Sessions, Engaged Sessions, Engagement Rate, Conversions (select your key conversion events), and Revenue (if ecommerce). Group by Session Default Channel Group.
This tells you exactly which channels (Organic Search, Paid Search, Social, Direct, Email, Referral) are driving not just traffic, but actual business outcomes. Save this as a custom report and check it weekly.
💡 Pro Tip: Add a comparison feature to see this week vs. last week and this month vs. last month. Trends matter more than absolute numbers. A channel that's declining week-over-week needs immediate investigation, even if the absolute numbers still look acceptable.
2. The Landing Page Performance Report (Which Pages Convert?)
Navigate to Reports > Engagement > Landing Page. Customize to show: Sessions, Engagement Rate, Average Engagement Time, Conversions, and Bounce Rate. Sort by Sessions first to find your highest-traffic pages, then sort by Conversion Rate to find your highest-converting pages.
The golden pages are those with both high traffic AND high conversion rates. Low-traffic, high-conversion pages are candidates for more promotion. High-traffic, low-conversion pages are your biggest CRO opportunities.
💡 Pro Tip: Create a custom dimension that tags landing pages by content type (blog, service page, product page, campaign landing page). This lets you compare performance across content types and allocate creation resources to the highest-converting formats.
3. The Conversion Funnel Report (Where Do Visitors Drop Off?)
Navigate to Explore > Funnel Exploration. Build a custom funnel matching your conversion path: Page View → Add to Cart / Form Start → Begin Checkout / Form Submit → Purchase / Thank You Page.
GA4 shows exact drop-off percentages at each step. If 70% of visitors drop off between "Add to Cart" and "Begin Checkout," your checkout page has a friction problem. If 50% drop off at the form, your form has too many fields. This report turns vague "we're not converting" complaints into specific, fixable problems.
💡 Pro Tip: Enable the "Show elapsed time" option in Funnel Exploration. This reveals how long users take between funnel steps. If the average time between "View Product" and "Add to Cart" is 8+ minutes, your product page needs stronger persuasion elements.
4. The User Acquisition Source Report (First Visit → Conversion Attribution)
Navigate to Reports > Acquisition > User Acquisition (not Traffic Acquisition). This report shows which channel originally brought a user to your site for the very first time — even if they converted on a later visit through a different channel.
This is critical for understanding which marketing efforts are actually bringing new customers into your ecosystem, vs. which channels are just capturing return visits from existing audiences.
💡 Pro Tip: Compare User Acquisition (first-touch) with Traffic Acquisition (session-level) side by side. If Organic Search dominates User Acquisition but Paid Social dominates Traffic Acquisition, your SEO brings in new users while your paid ads bring them back to convert. Pair this with a strong Performance Marketing Strategy to maximize attribution insights.
5. The Audience Engagement Report (Who Are Your Best Visitors?)
Navigate to Explore > Free-form Exploration. Build a report with dimensions: Country, City, Device Category, Age, Gender (if demographic data is enabled). Add metrics: Sessions, Engagement Rate, Conversions, Revenue.
This reveals your most valuable audience segments. You might discover that mobile users from Mumbai aged 25–34 convert at 3x the rate of desktop users from Delhi aged 45–54. This insight directly informs your ad targeting, content strategy, and budget allocation.
💡 Pro Tip: Use GA4's Predictive Audiences feature. GA4 can automatically identify users "Likely to purchase in 7 days" or "Likely to churn." Export these audiences to Google Ads for precision retargeting of your highest-value prospects.
6. The Content Performance Report (Which Content Drives Results?)
Navigate to Reports > Engagement > Pages and Screens. Customize to show: Views, Users, Average Engagement Time, and Conversions. Filter by page path containing /blog/ to isolate content pages.
Sort by Conversions to identify which content pieces directly contribute to business outcomes. This report answers the perennial question: "Is our blog actually generating leads?" with specific data for each post.
💡 Pro Tip: Create a custom event for "scroll to CTA" using Google Tag Manager or GA4's built-in scroll tracking. This reveals how many visitors reach your in-content CTAs. If only 20% scroll to your CTA, you need to move it higher in the content.
7. The Campaign ROI Dashboard (Is Our Ad Spend Profitable?)
Navigate to Advertising > Performance (or build a custom Explore report). Ensure your Google Ads, Meta Ads (via UTM parameters), and other campaign sources are properly tagged. Build a dashboard showing: Campaign Source/Medium, Cost (imported from Google Ads), Conversions, Revenue, and ROAS (Revenue ÷ Cost).
This single dashboard answers the most important marketing question: is our ad spend generating more revenue than it costs? Update it weekly and share with stakeholders.
💡 Pro Tip: Set up Data Import in GA4 to pull cost data from non-Google ad platforms (Meta, LinkedIn). Without cost data imported, you can only calculate ROAS for Google Ads natively. With imported cost data, you can compare true ROAS across all channels in one view.
Frequently Asked Questions
Is GA4 free to use?
Yes. Google Analytics 4 is completely free for most businesses. GA4 360 (the enterprise version) is paid, but the standard version handles up to 10 million events per month, which is more than sufficient for the vast majority of Indian businesses.
How do I track conversions in GA4?
Navigate to Admin > Events > Mark as Conversion. Common conversion events include form submissions (generate_lead), purchases (purchase), and phone clicks (click with tel: links). You can also create custom events via Google Tag Manager or professional Analytics Configuration Services.
What is the difference between GA4 and Universal Analytics?
GA4 uses an event-based data model (every interaction is an event) vs. UA's session-based model. GA4 tracks users across devices, has built-in machine learning predictions, and supports both web and app tracking natively.
How long does GA4 setup take?
Basic GA4 setup (tag installation, conversion tracking, linking Google Ads) takes 1–2 hours. Full configuration (custom events, ecommerce tracking, data import, custom reports) takes 4–8 hours for an experienced analyst. Businesses often accelerate implementation through Data Strategy Consulting Services.
Can GA4 track offline conversions?
Yes, via the Measurement Protocol or Data Import features. You can upload CRM data (lead status changes, closed deals) to GA4 to connect online marketing with offline sales outcomes.